I met an amazingly smart 2nd year grad student on my geology trip. A bit of background - two dozen geologists (actually, two astro kids and a Mech E were included in the jovial bunch) traipsed their way down to Baja California -- not in such a lackadaisical manner, with more intent -- but we made our way down to explore a bunch of rock formations, paleomag, a bit of cretaceous-dinosaur-fauna things, etc.
A few of us had wandered down to the beach at the Salton Sea the first night. When lasers came out, there was a period of comparing the power output of the lights and the distance this corresponded too.
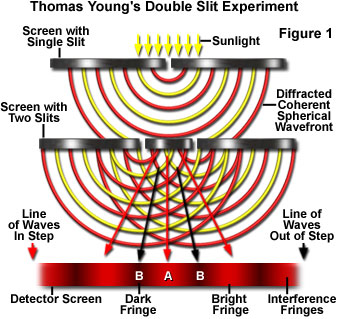
But when you put a slight obstruction in the beam of the light -- we were using green lasers, best for seeing in the dark and for pointing out stars -- you get a diffraction pattern in the output light. There is a very obvious pattern of dark and light. Now, apparently, these are the Fourier transform of a single slit diffraction pattern! The light is blocked for exactly a top-hat function, and the resultant pattern has an intensity (not energy) that we see. The transform of the energy is the sinc function, but the intensity of the light is the sinc function squared.
Now, imagine two obstructions -- two hairs. On the ground, then, you see the pattern repeated, the standard diffraction of light and dark that progressively gets dimmer farther from the center. This is the first and the second fourier transform.
Yay :) You can do this for any number of obstructions!
Reflecting the laser off your teeth, your are confronted with a large number of organic shapes that have an apparent depth to the layers. They form moving shapes that crawl in green shadows across the ground, changing and disappearing. These are the fourier transform of...saliva. Ha ;)
Showing posts with label Fourier transforms. Show all posts
Showing posts with label Fourier transforms. Show all posts
Wednesday, November 16, 2011

Sunday, October 9, 2011
Observing, Oct 7-8
Look up We the Kings' She takes me high <3

One of the greatest things about Caltech is scientific opportunities for our undergrads, viz. myself. :)
 This was really enforced yesterday (the general case, not only the specific :D). Melodie, who has joined our ay20 problem solving sessions, generously invited me to observe using Keck's HIRES off-link thing at Caltech! We had a couple of lab write ups we wanted to do, and a Friday night seemed the best time to attempt them.
Around eight to midnight, we were on-and-off working on the second worksheet, the results which were posted. But a lot of the time was just spent chatting about school and astronomy, as well as significant periods where Melodie was amazing and taught me about Fourier transforms - their purpose, and why we love them.
Here are the relevant graphs in normal and fourier space:
 |
| Delta function; in Fourier space it is a cosine function |
 |
| the top hat function, in normal (left) and fourier space |
This means we can multiply the sinc and the cosine function and get, from the square of the convolution, the intensity and energy of the observed lines!
One of the most important things to take into account are the full-width-half-max (FWHM) of each line. The line is broader with more scatter, and a wider w. This is generally bad. By thinking about it, I think we came to the conclusion that angular resolution was better as w increased and the wavelength of observed light decreased.
But as a wider line gives us a different angular resolution, this can be helpful sometimes. That's why the Very Large Array (VLA) has such great radio accuracy - it couples dishes into different angular resolutions so large and small scale structures in the received waves can be resolved out of the data. (See Juliette's post for a great overview on this!) Moreover, if most of our photons come from a single section, it may distort the actual depths of the emission/absorption lines, because in the data it looks relatively much deeper or shallower. All this is important to any informed observer.
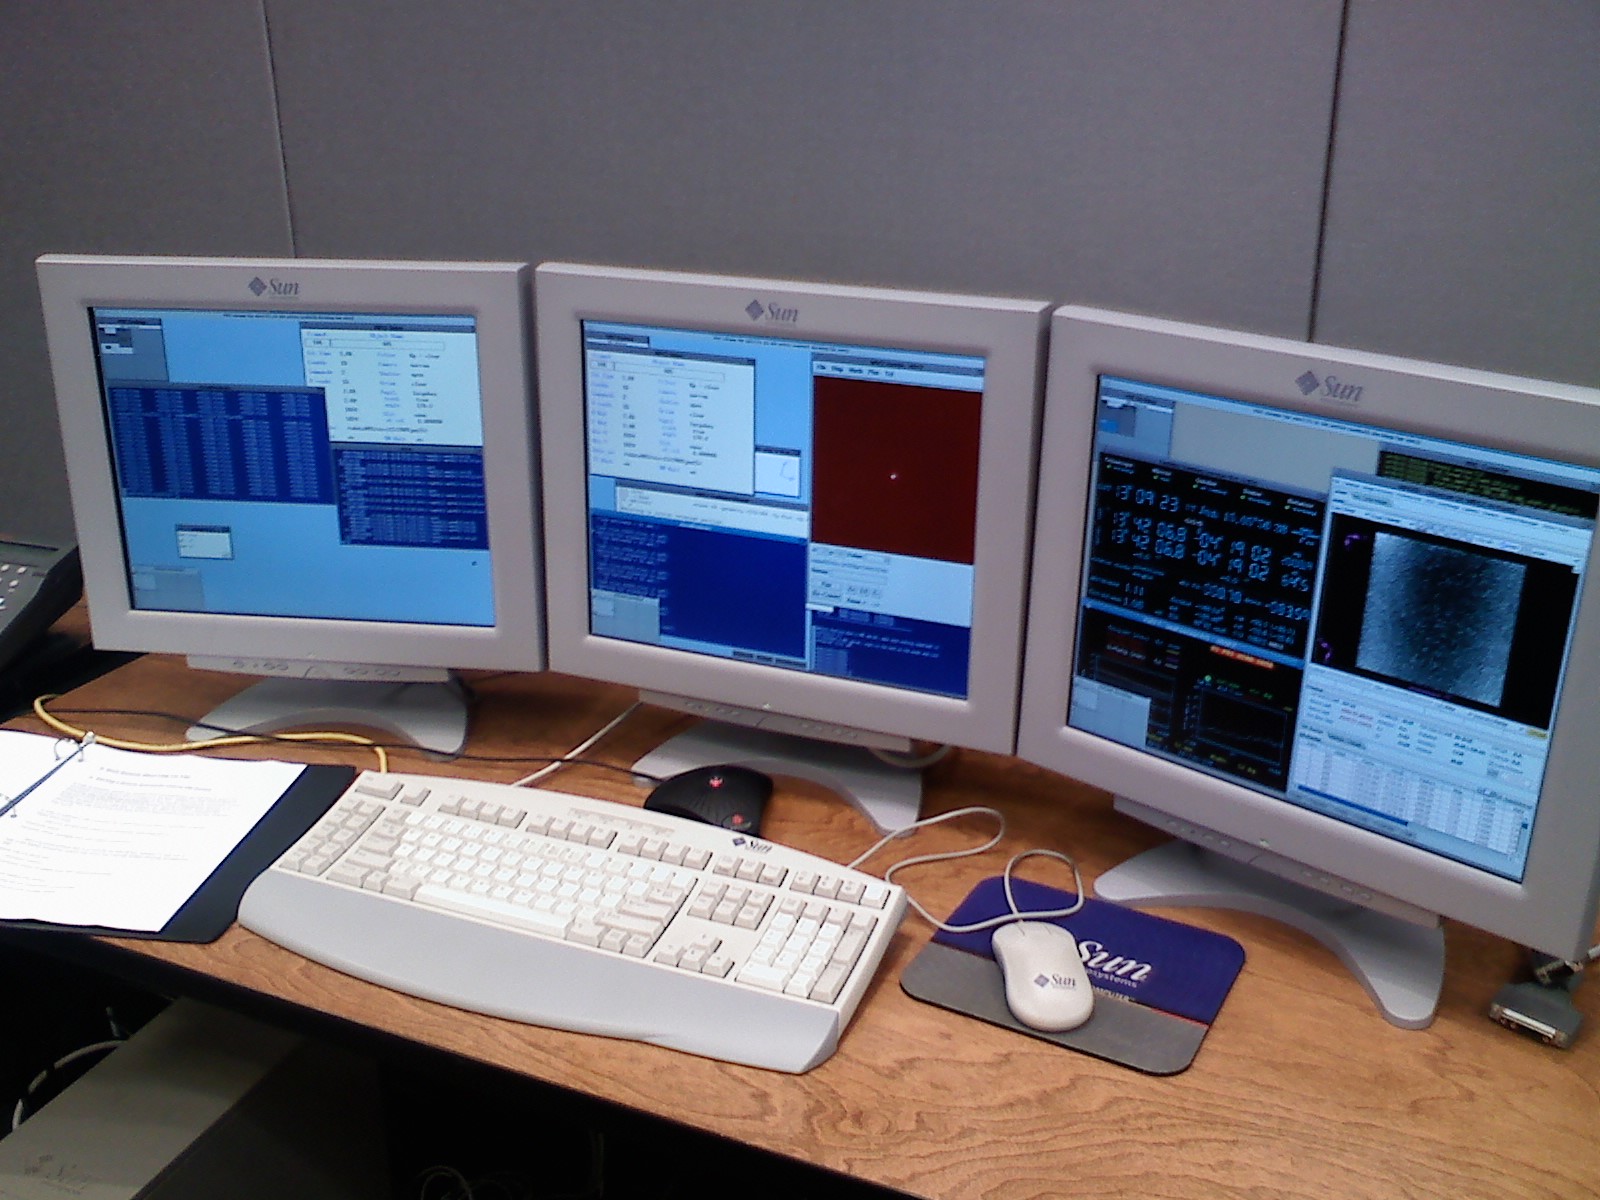 |
| Our setup, which included a video link to people in Hawaii at 9000ft elevation and at the actual telescope. Later we linked with the Princeton team. |
Conditions at the telescope were terrible. There was a lot of cloud cover, which is obviously terrible. The target S/N ratio was (maybe) around 200 for brighter stars, with an absolute time limit spent on each star of about 500s (these numbers and any following may be kind of off, as its all coming from a mal-adjusted memory). This was far from achievable, esp. during the early part of observation. Under perfect conditions, seeing - a measure related to how nice the spectrum taken will look, i.e. 0 is no attenuation - you have about a 0.3-0.5 seeing from atmospheric affects. We were at 1.5-2.0 the whole night, with the horizon obscured almost constantly and the clouds luckily breaking up into patches by the end of our 6-ish hour shift, ending around 3:00-3:30 am.
At one point, another of the first -year grad students, a theorist from Oxford, wandered in. He was really excited and cool, and asked a very interesting question. Professor Johnson would love him - Avinash? maybe :) - kept apologizing for having so many "dumb" questions to our lead observer, Sebastian, that actually were amazingly insightful. For instance, apparently clouds do not matter much regarding the actual spectra we read (at least for HIRES, as the water absorption lines are in the (near-)infrared and not so relevant when we are taking observations in the visible light spectrum.
Yep. They're observing now, in Cahill, so props to Melodie and Sebastian!
Apologies for any mistakes in the above: no notes were taken during lectures in the wee hours of the morning.
Subscribe to:
Posts (Atom)